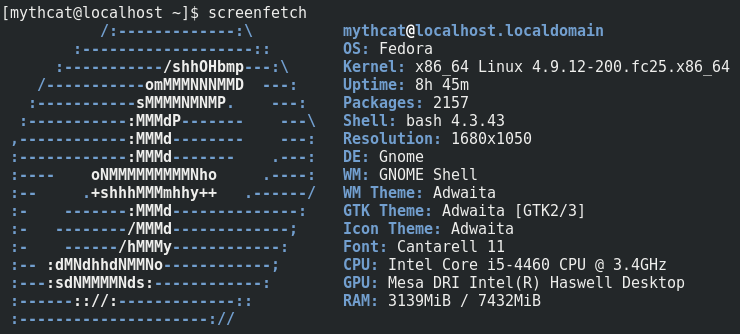
Let's see my ScreenFetch:
[root@localhost mythcat]
# rpm -ivh http://linuxdownload.adobe.com/adobe-release/adobe-release-x86_64-1.0-1.noarch.rpm
Retrieving http://linuxdownload.adobe.com/adobe-release/adobe-release-x86_64-1.0-1.noarch.rpm
warning: /var/tmp/rpm-tmp.yTBgjV: Header V3 DSA/SHA1 Signature, key ID xxxxxxx: NOKEY
Preparing...                          ################################# [100%]
Updating / installing...
   1:adobe-release-x86_64-1.0-1       ################################# [100%]
[root@localhost mythcat]# rpm --import /etc/pki/rpm-gpg/RPM-GPG-KEY-adobe-linux
[root@localhost mythcat]# dnf install flash-plugin alsa-plugins-pulseaudio libcurl
Adobe Systems Incorporated                       11 kB/s | 2.0 kB     00:00
Package alsa-plugins-pulseaudio-1.1.1-1.fc25.x86_64 is already installed, skipping.
Package libcurl-7.51.0-4.fc25.x86_64 is already installed, skipping.
Dependencies resolved.
================================================================================
 Package         Arch      Version                  Repository             Size
================================================================================
Installing:
 flash-plugin    x86_64    24.0.0.221-release       adobe-linux-x86_64    9.2 M

Transaction Summary
================================================================================
Install  1 Package

Total download size: 9.2 M
Installed size: 22 M
Is this ok [y/N]: y
Downloading Packages:
flash-player-npapi-24.0.0.221-release.x86_64.rp 1.2 MB/s | 9.2 MB     00:07
--------------------------------------------------------------------------------
Total                                           1.2 MB/s | 9.2 MB     00:07
Running transaction check
Transaction check succeeded.
Running transaction test
Transaction test succeeded.
Running transaction
  Installing  : flash-plugin-24.0.0.221-release.x86_64                      1/1
  Verifying   : flash-plugin-24.0.0.221-release.x86_64                      1/1

Installed:
  flash-plugin.x86_64 24.0.0.221-release

Complete!
[root@localhost mythcat]#
load average: 0.09, 0.05, 0.01[mythcat@localhost ~]$ perf record -e cpu-clock -ag
Error:
You may not have permission to collect system-wide stats.
Consider tweaking /proc/sys/kernel/perf_event_paranoid,
which controls use of the performance events system by
unprivileged users (without CAP_SYS_ADMIN).
The current value is 2:
-1: Allow use of (almost) all events by all users
>= 0: Disallow raw tracepoint access by users without CAP_IOC_LOCK
>= 1: Disallow CPU event access by users without CAP_SYS_ADMIN
>= 2: Disallow kernel profiling by users without CAP_SYS_ADMIN
[mythcat@localhost ~]$ su
Password:
[root@localhost mythcat]# perf record -e cpu-clock -ag
^C[ perf record: Woken up 17 times to write data ]
[ perf record: Captured and wrote 5.409 MB perf.data (38518 samples) ]
[root@localhost mythcat]# ls -l perf.data
-rw-------. 1 mythcat mythcat 5683180 Feb 21 13:24 perf.data[mythcat@localhost ~]$ perf report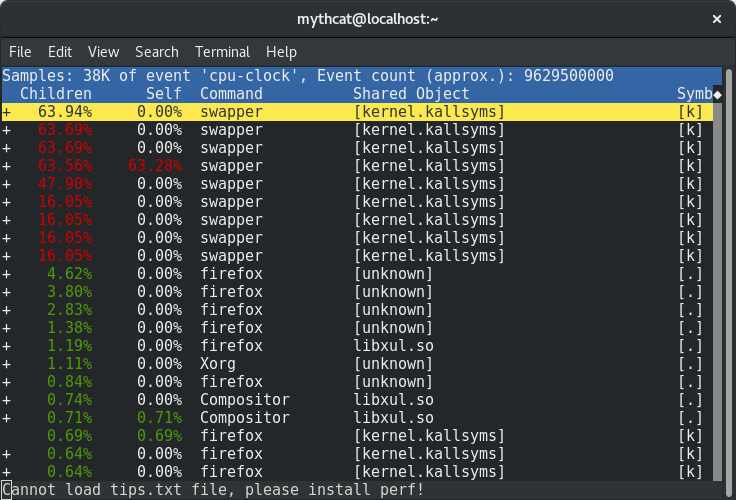 You can use the full list events by using this command:
[mythcat@localhost ~]$ perf list

List of pre-defined events (to be used in -e):

  branch-instructions OR branches                    [Hardware event]
  branch-misses                                      [Hardware event]
  bus-cycles                                         [Hardware event]
  cache-misses                                       [Hardware event]
  cache-references                                   [Hardware event]
  cpu-cycles OR cycles                               [Hardware event]
  instructions                                       [Hardware event]
  ref-cycles                                         [Hardware event]

  alignment-faults                                   [Software event]
  bpf-output                                         [Software event]
  context-switches OR cs                             [Software event]
  cpu-clock                                          [Software event]
  cpu-migrations OR migrations                       [Software event]
  dummy                                              [Software event]
  emulation-faults                                   [Software event]
  major-faults                                       [Software event]
  minor-faults                                       [Software event]
  page-faults OR faults                              [Software event]
  task-clock                                         [Software event]
[root@localhost mythcat]# perf top -e minor-faults -ns comm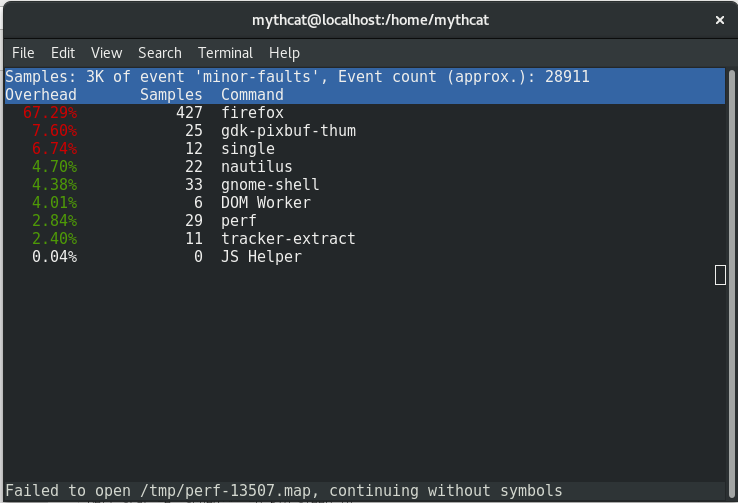 This is most simple way to see how is start and close some pids and how they interact in real-time with the operating system.
Another way to deal with the perf command is how to analyze most scheduler properties from within 'perf sched'
alone using the perf sched with the five sub-commands currently:
This is most simple way to see how is start and close some pids and how they interact in real-time with the operating system.
Another way to deal with the perf command is how to analyze most scheduler properties from within 'perf sched'
alone using the perf sched with the five sub-commands currently:
perf sched record            # low-overhead recording of arbitrary workloads
perf sched latency           # output per task latency metrics
perf sched map               # show summary/map of context-switching
perf sched trace             # output finegrained trace
perf sched replay            # replay a captured workload using simlated threads
perf sched record sleep 10     # record full system activity for 10 seconds
perf sched latency --sort max # report latencies sorted by max [root@localhost mythcat]# perf sched record [mythcat@localhost Geekbench-4.0.4-Linux]$ ls
geekbench4 geekbench.plar geekbench_x86_32 geekbench_x86_64
[mythcat@localhost Geekbench-4.0.4-Linux]$ ./geekbench4
[0219/140337:INFO:src/base/archive_file.cpp(43)] Found archive at
/home/mythcat/build.pulse/dist/Geekbench-4.0.4-Linux/geekbench.plar
Geekbench 4.0.4 Tryout : http://www.geekbench.com/
Geekbench 4 is in tryout mode.
Geekbench 4 requires an active Internet connection when in tryout mode, and
automatically uploads test results to the Geekbench Browser. Other features
are unavailable in tryout mode.
Buy a Geekbench 4 license to enable offline use and remove the limitations of
tryout mode.
If you would like to purchase Geekbench you can do so online:
https://store.primatelabs.com/v4
If you have already purchased Geekbench, enter your email address and license
key from your email receipt with the following command line:
./geekbench4 -r email address="" license key=""
Running Gathering system information
System Information
Operating System Linux 4.9.9-200.fc25.x86_64 x86_64
Model Gigabyte Technology Co., Ltd. B85-HD3
Motherboard Gigabyte Technology Co., Ltd. B85-HD3
Processor Intel Core i5-4460 @ 3.40 GHz
1 Processor, 4 Cores, 4 Threads
Processor ID GenuineIntel Family 6 Model 60 Stepping 3
L1 Instruction Cache 32.0 KB x 2
L1 Data Cache 32.0 KB x 2
L2 Cache 256 KB x 2
L3 Cache 6.00 MB
Memory 7.26 GB
BIOS American Megatrends Inc. F2
Compiler Clang 3.8.0 (tags/RELEASE_380/final)
Single-Core
Running AES
Running LZMA
Running JPEG
Running Canny
Running Lua
Running Dijkstra
Running SQLite
Running HTML5 Parse
Running HTML5 DOM
Running Histogram Equalization
Running PDF Rendering
Running LLVM
Running Camera
Running SGEMM
Running SFFT
Running N-Body Physics
Running Ray Tracing
Running Rigid Body Physics
Running HDR
Running Gaussian Blur
Running Speech Recognition
Running Face Detection
Running Memory Copy
Running Memory Latency
Running Memory Bandwidth
Multi-Core
Running AES
Running LZMA
Running JPEG
Running Canny
Running Lua
Running Dijkstra
Running SQLite
Running HTML5 Parse
Running HTML5 DOM
Running Histogram Equalization
Running PDF Rendering
Running LLVM
Running Camera
Running SGEMM
Running SFFT
Running N-Body Physics
Running Ray Tracing
Running Rigid Body Physics
Running HDR
Running Gaussian Blur
Running Speech Recognition
Running Face Detection
Running Memory Copy
Running Memory Latency
Running Memory Bandwidth
Uploading results to the Geekbench Browser. This could take a minute or two
depending on the speed of your internet connection.
Upload succeeded. Visit the following link and view your results online:
OpenSSL Security Advisory [16 Feb 2017]
========================================

Encrypt-Then-Mac renegotiation crash (CVE-2017-3733)
====================================================

Severity: High

During a renegotiation handshake if the Encrypt-Then-Mac extension is
negotiated where it was not in the original handshake (or vice-versa) then this
can cause OpenSSL to crash (dependent on ciphersuite). Both clients and servers
are affected.

OpenSSL 1.1.0 users should upgrade to 1.1.0e

This issue does not affect OpenSSL version 1.0.2.

This issue was reported to OpenSSL on 31st January 2017 by Joe Orton (Red Hat).
The fix was developed by Matt Caswell of the OpenSSL development team.

Note
====

Support for version 1.0.1 ended on 31st December 2016. Support for versions
0.9.8 and 1.0.0 ended on 31st December 2015. Those versions are no longer
receiving security updates.

References
==========

URL for this Security Advisory:
https://www.openssl.org/news/secadv/20170216.txt

Note: the online version of the advisory may be updated with additional details
over time.

For details of OpenSSL severity classifications please see:
https://www.openssl.org/policies/secpolicy.html
[root@localhost Downloads]# dnf install skype-4.3.0.37-fedora.i586.rpm
Last metadata expiration check: 2:47:29 ago on Wed Feb 15 12:56:31 2017.
Dependencies resolved.
================================================================================
 Package              Arch   Version                              Repository
                                                                           Size
================================================================================
Installing:
 alsa-lib             i686   1.1.1-2.fc25                         fedora  411 k
 alsa-plugins-pulseaudio
                      i686   1.1.1-1.fc25                         fedora   45 k
 bzip2-libs           i686   1.0.6-21.fc25                        updates  44 k
 cairo                i686   1.14.8-1.fc25                        updates 750 k
 ...

 xz-libs              i686   5.2.2-2.fc24                         fedora   98 k
 zlib                 i686   1.2.8-10.fc24                        fedora   98 k

Transaction Summary
================================================================================
Install  104 Packages

Total size: 90 M
Total download size: 71 M
Installed size: 264 M
Is this ok [y/N]: y
...

  sni-qt.i686 0.2.6-7.fc24
  sqlite-libs.i686 3.14.2-1.fc25
  systemd-libs.i686 231-12.fc25
  tcp_wrappers-libs.i686 7.6-83.fc25
  xz-libs.i686 5.2.2-2.fc24
  zlib.i686 1.2.8-10.fc24

Complete!